The Olympics and circle defence
Germany's Achilles heel?
Takeaways
Summary match data can be analysed statistically to examine patterns of play and look for differences between teams.
Usually summary data is scrutinised from an attacking perspective but it is just as easy to use the same data to ask how well teams defend.
Here, Germany is shown to have conceded more circle entries per game than other high ranked teams despite having the highest amount of possession.
Introduction
In the last article I looked at some of the possession and circle entry numbers from the women’s side of the Olympic Games. We nearly always look at these kind of data from the attacking point of view. It is the obvious perspective to take since possession, circle entries along with shots and penalty corners are metrics derived from having the ball. They are concerned with, and say something about the attacking team.
But we can, though we hardly ever do, flip this on its head and ask similar questions from the defending perspective. If one knows the average number of, say, circle entries a team has in a tournament, one also has the information on how many circle entries the team conceded. The number of circle entries the Dutch made, for example, is obviously found by adding up the number for each match. The number of circle entries the Dutch concede comes simply from adding together the number of circle entries the Dutch opponent’s made. For the Dutch that would be adding up the circle entries made by Belgium, China, Germany, France and Japan in the pool games. And then Great Britain, Argentina and China again in the knockout stages. After doing this we have, and then can analyse, how well each team defended their circle.
Opposition possession
For possession the comparison is not all that interesting. When measured as a percentage, possession is bounded within a set range. So, how much possession a team had also indicates how much possession their opponents had. Hence, if the Dutch had 54% possession on average in the pool games, you know that their opponents had 46%.
But, in an effort to be thorough I will kick off with the opponents possession for each team as we are going to use these data to look at the efficiency of circle entries in the same way we did in the last article.
Of course nothing really surprising here. It is clear that Germany, the Netherlands and Argentina in particular enjoyed much more possession in comparison to their opponents, and how much teams like France and South Africa conceded possession to their opponents. Note too that Australia, Belgium and China kept the ball for less time than their opponents but still graduated from the pool stages.
Circle defence
Moving on to the opposition’s circle entries becomes more interesting. First we check whether there is a relationship between possession and circle entries as we did before but this time from the opponents perspective.
And it is not surprising (since it just resorting the same data) that there is a clear correlation (r-Pearson = 0.45 on the top line of statistical summaries) between your opponent's having the ball and them getting into your circle.
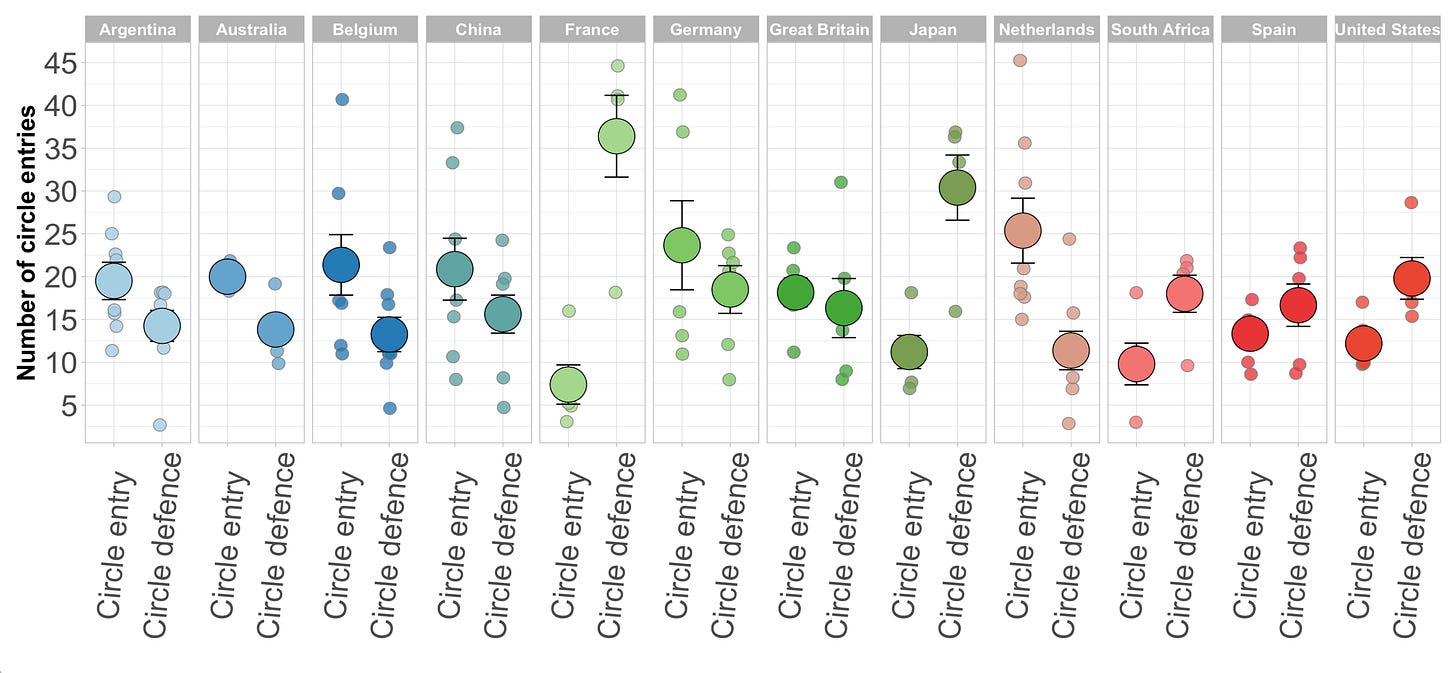
As for the average number per team, it looks like this.
The left value of each team’s pair is the attacking circle entries (‘Circle entry’) and the right value is their opponents circle entries (‘Circle defence’) indicating how well each team did, or did not, keep the opposition out of their circle. Remember, the value for ‘Circle defence’ comes from finding the average of the circle entries made by all the teams that played against the team of interest.
There are some interesting points that are worth highlighting. France and Japan allowed the most entries into their circle - that’s clear. They are in a group by themselves as having both the widest difference between circle entries and circle defence while also allowing the highest number of circle entries by their opponents overall. This was a poor tournament in this context for Japan, a team ranked two places above the United States, eight above France and ten above South Africa.
As we look across the pairings we can see that the rest are pretty much as expected. Teams that performed less well allowed more entries into their own circle than they made into the opponents circle (South Africa, Spain, United States for example) and teams that did well generally have higher numbers of circle entries against their opponents than they conceded to their opponents.
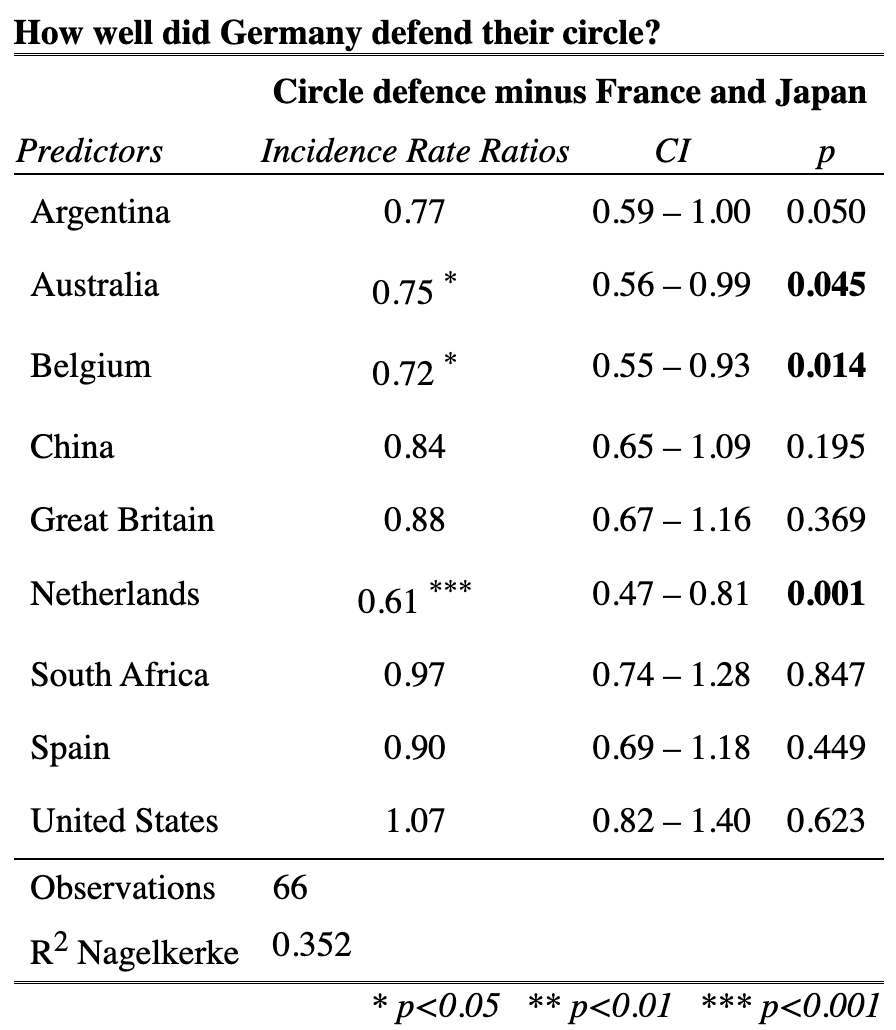
Germany is interesting here. For a team that had 58% possession (and we know possession correlates with circle entry) the number of attacking circle entries is almost the same as the number they conceded. In the subsequent analysis (having removed France and Japan who constitute a group of their own) I’ve put Germany as the reference team to which all the other are compared and asked the simple question: how good are other teams circle defence when compared to Germany? The answer looks like this.
The first thing to note is that all the teams except for the United States, have Incidence Rate Ratios (IRR) less than one when compared to Germany. An IRR of 1 suggests that there is no difference in circle defence between any of these teams and Germany. So eight of the nine teams in this comparison allowed fewer circle penetrations than the Germans. That’s an interesting initial conclusion.
Conceding fewer circle entries than the Germans doesn’t mean that these are significant effects though. The only significant differences come when Germany is compared to Belgium, Australia and the Netherlands (the bold values in the ‘p’ column). The Netherlands result might not be too surprising. But note that both Belgium and Australia’s opponents had considerably more time on the ball than Germany’s opponents (Figure 1), yet these two teams conceded significantly fewer circle entries than Germany.
Circle defence and possession
The other teams are not formally different to Germany the result does raise the question of what happens if we take possession into account. In other words, if we control for the different amount of possession each team’s opponents had, how does the circle defence look then?
Well, overall it looks like this.
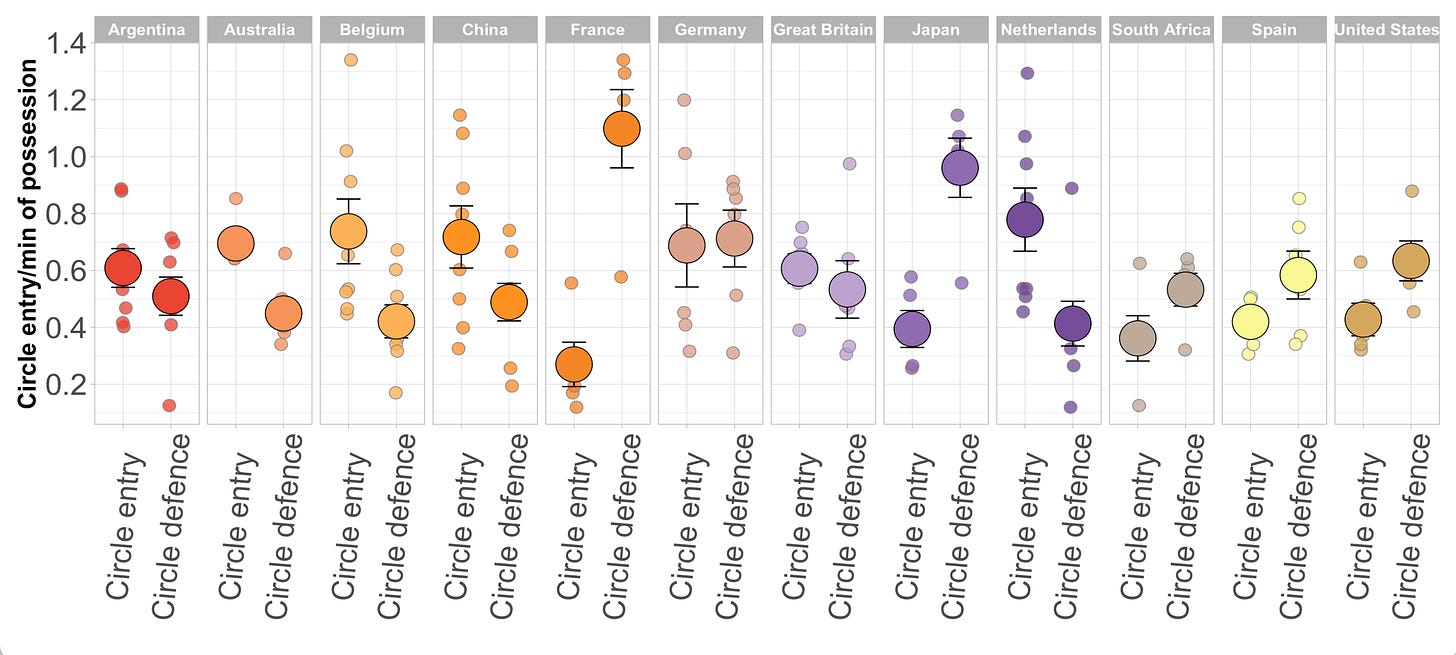
Again, figure 4, like figure 3, compares the ability of a team to get into their opponents circle, with their opponents success at getting into their circle. This time however, the amount of possession a team and their opponents had is controlled for: each circle entry/defence value is summarised as an entry per minute of possession. It is now a rate process.
When looked at in this way France and Japan remain teams that allowed a lot of circle penetrations irrespective of the amount of possession their opponents had. There isn’t much difference for the Dutch, their rate of attacking entries is considerably larger than the rate they let their opponents into their circle. And Australia and Belgium and China also have noticeably better circle entry rates than circle defence. Once again, this is impressive given all three of these teams had less possession than their opponents.
Again though the eye is drawn to Germany. Now the large possession difference Germany had compared to their opponents is taken into account, we can see that there is very little difference in the rate Germany got into their opponents’ circle compared to the rate their opponents got into Germany’s circle. It is certainly worth redoing the analysis with this in mind and the question is then: How well did Germany defend their circle when the amount of possession each opponent had is taken into account?
Again in Table 2, France and Japan have been left out as they are clearly different to all the other teams for both the number of circle entries they conceded as well as the rate at which they conceded those circle entries. All the other teams are again compared to Germany and the conclusion is quite striking. The rate at which Germany allowed other teams to get into their circle was higher than all other teams bar Spain and the United States (and of course France and Japan as above). Great Britain is on the border line of being statistically different and the difference between South Africa is not strong though it is still significant. For a team whose technical ability in deep defence is often praised the extent to which other teams did better at defending the circle in comparison to Germany is quite surprising.
Summarising this produces these groups.
There are France and Japan as the ‘High’ number of opposition circle entries outliers. Then the German group with Spain and the United States, and then the rest in the ‘Low’ group.
South Africa’s performance is impressive. Clearly a team that struggled with possession (Figure 1), that also struggled to create more attacking circle entries than those they conceded to their opponents (Figure 2), but for the amount of possession their opponents had, South Africa defended their circle as well as some of the much more highly ranked teams.
But back to Germany. Were they particularly poor at defending their circle? Did they rely too much on defending in the abstract, not by the physical process of making tackles and interceptions but rather by keeping the ball away from their opponents. And because in all their games Germany had at least 53% possession one wonders what happened when they lost? In comparison to say, the other quarter finalists did they concede more circle entries when the lost than the other seven teams who made it to the knockouts when they lost (six teams, actually as the Dutch didn’t lose).
Yes they did concede circle entries at a higher rate. The sample size is of course small, Germany lost three games of the six they played at the Olympics. Still, on average Germany conceded 22 circle entries per losing game at a rate of 0.9 circle entries per minute of opposition possession. This is in contrast to the other quarter finalists conceding 18 circle entries per game to their opponents at a rate of just 0.5 per minute of possession.
In summary, this is another example of taking some very simple data and exploring it statistically. Such analytical scrutiny can reveal insights that are otherwise masked when comparing summary data ‘by eye’. Indeed, with formal analysis we could dig into a number of teams in this contest and nail down just how much better or worse they were from each other. Germany were just one of the teams that stood out clearly in the analytic context of this post but Belgium, for opposite reasons, might equally deserve a closer look.
Was this relative poor circle defence an obvious component explaining why Germany placed third in their pool and didn’t proceed beyond the quarter finals? Perhaps. But to get more information, to produce a more holistic picture of the pluses and minuses of Germany’s (and other teams) performance one would need to explore more and different data. Which I’ll get into in subsequent posts.


Great analysis!