In the last article I highlighted a network summarising ball movement across the pitch in a game between Spain and Belgium. The endpoints being modelled were the probability a team made a successful circle entry or turned the ball over to their opponents. The network was explicitly spatial - how the ball was moved around the pitch - and didn’t provide any information about who was moving the ball.
Here is a similar way of using network analysis but from a slightly different point of view.
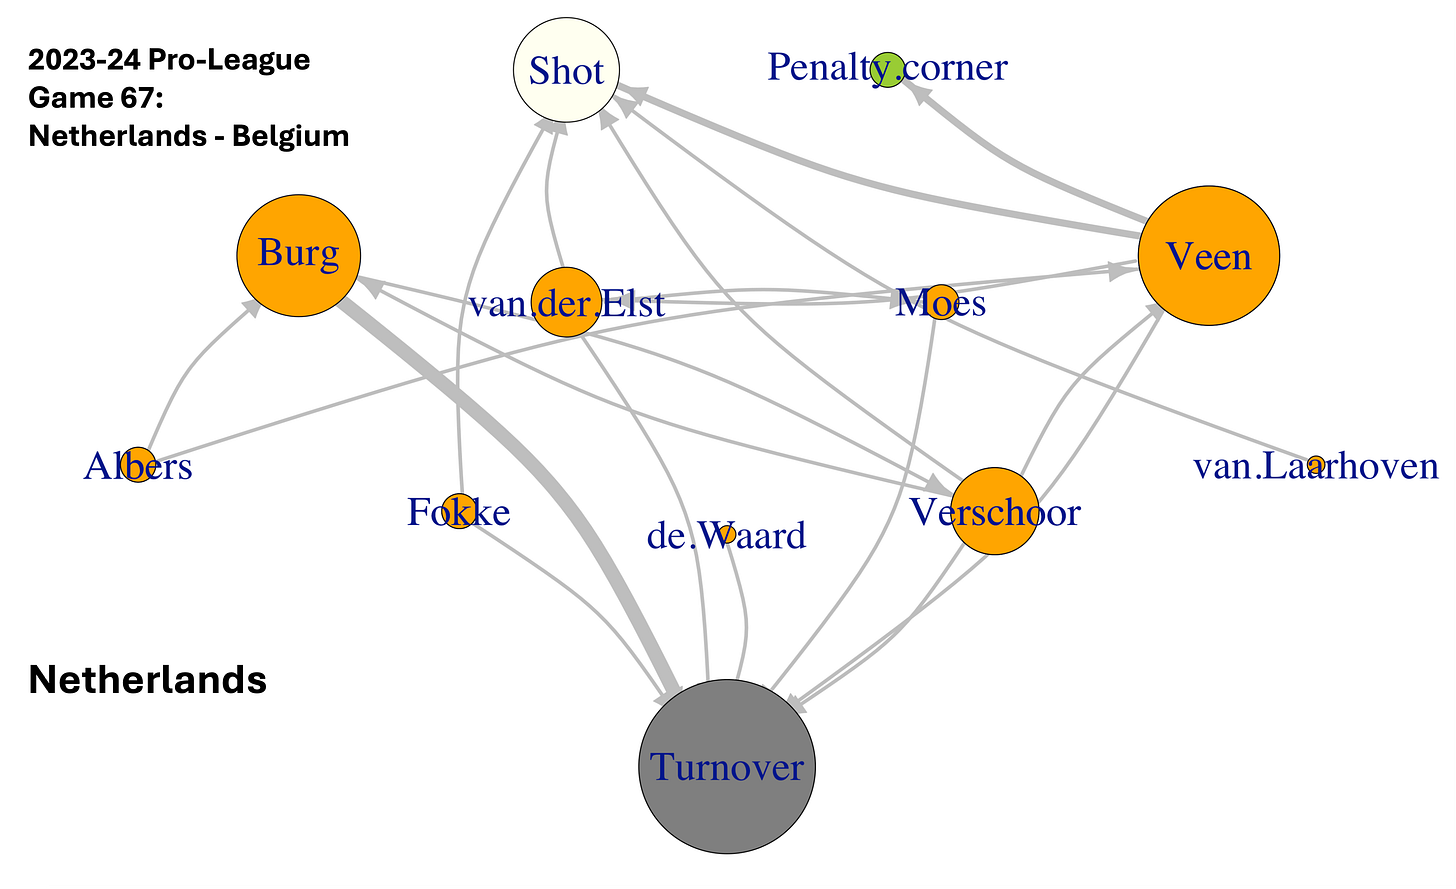
This network shows the Dutch players who made an action in the circle - dribble, pass, shot, PC award, turnover. This match was one of a series of double-headers played at Kampong and Amsterdam, between the Netherlands, Belgium, Germany and Great Britain in last season’s Pro-League tournament. This was Game 67 between the Netherlands and Belgium.
Switching the focus of the analysis from space use to player actions allows a very specific assessment of player performance, their action and outcome success rates. The information that can be gathered is essentially the same as I outlined in the previous article but the presentation of the network is a little different. First there are no numbers showing the direct probability of completing an action. This information is now shown by the thickness of the connecting lines - the thicker the line, the more ‘traffic’ there was. Second, the size of each circle represents the importance of a player or outcome in relation to other players and outcomes. The larger the circle the more prominent the player or the outcome type was. The result is an accessible visual representation of the actions players make (and how that connects with other players and outcomes) not a detailed number chart
Here is the Belgian player network from the same game.
I said I wasn’t going to go into the actual analytic outputs of this too much but the visualisation immediately gives you a sense of the difference between the two teams and the relative contributions of the players involved. The Dutch network is well populated with different players (nine in this first game) and though that isn’t very different to the Belgian’s eight players the connections between these Dutch players is much ‘busier’ than it is from the Belgian players.
The pattern you can see is characteristic for both teams but for once these Dutch connections don’t lead to success. What prevails is the Belgian’s corner winning (six from in the circle and two from outside compared to three won in the circle for the Dutch) and efficiency of execution. The Dutch, without Yibbi Jansen and Frédérique Matla, had Renée van Laarhoven and Sanne Koolen at the top to hit and slap the ball at goal instead. Belgium won 2-1 to give them a first major tournament victory against the Dutch and an end to the Netherlands 26 game winning streak.
The second game looked like this.
It’s a nice example of how these network visualisations can capture differences between teams. The Dutch now have ten different players involved, Marijn Veen and Joosje Burg again prominent and Burg in particular improving her outcome probabilities from the 90% turnover rate she had in the first game. Belgium on the other hand were completely stymied in the circle managing no shots (hence no “Shot” circle), a single corner and once again very limited in-circle connections between their players. The Dutch got back on track winning 2-1.
Single games offer some interesting insights - both the direct performance of players, their relative performance and connections and overall how this combines to shape outcome probabilities.
Accumulation of this kind of data over a number of games would also allow one to see what each player’s fundamental performance looks like, that is their long term patterns and success of their actions and decisions. And once a really good dataset is collected, networks can be built that include a spatial component, how a player performs in different areas of the circle. This is something on the list to look at (admittedly an increasing long list) - how does Matla compare to Burg, Veen to Moes for example. Or further, why not a select a group of players from different teams (Frédérique Matla, Belgium’s Charlotte Englebert and Germany’s Charlotte Stapenhorst say), and do a comparative analysis on the decisions these leading forwards make and the successful (or not) outcome of those decisions.
While that remains on the (long) list, I thought for the next article I’d show an interesting interpretation of the spatial distribution of high value chances in the circle.


