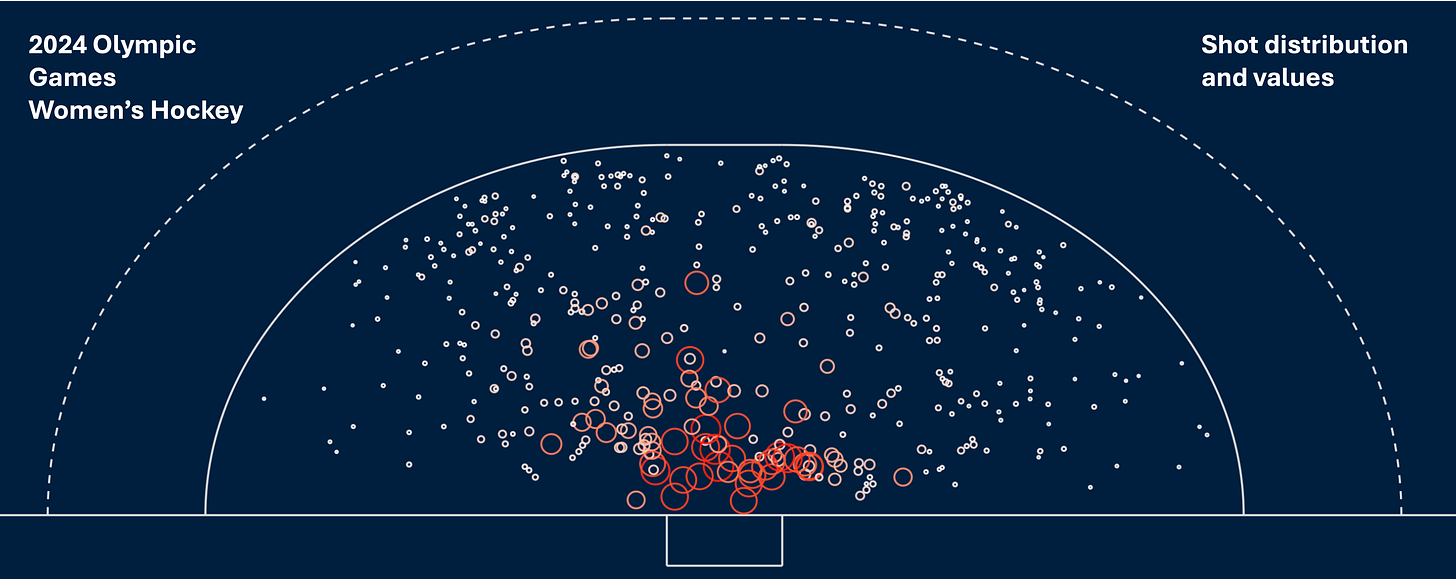
You’ve now all seen this kind of representation of shots and the probability values associated with them.
The larger the circle in Figure 1, the higher the probability that the shot will become a goal and just because I am a helpful person the actual scoring probability is shown too.
There is more information behind each of these shots of course, both the core information of the event - the 0.2008 shot was by Frédérique Matla for the Netherlands in their pool game against Japan (goalkeeper saved it) - and the information that feeds the model (distance, angle, pressure, crowding, etc).
This naturally builds to a complete tournament dataset where, as in Figure 2, circle size corresponds to shot value as does the colour - white for the lowest value shots shading to red for the highest value shots. Building up datasets of shot values for teams, for individual players, across time, across different tournaments, across hockey generally, provides an excellent basis for further analysis.
But what makes for a good shot? Many shots taken by players have very low scoring probabilities (note the number of small white circles in Figure 2). That being the case, how do we help players decide what is a good shooting decision and what is not?
Previously I have looked at this question in the context of the value of penalty corners. But there is another way of determining whether a shot is likely to become a goal and that method can be calculated during the process of creating the statistical model that generates the shot probability values.
The process is akin to how your email application looks at incoming messages and decides whether the missive sent should go to your inbox or to your spam folder. The email system could notify you that an email has arrived and provide a probability value indicating whether the email received is likely to be spam - this one is 0.21, that 0.85, the other 0.05 etc - and let you decide the folder to which the email should be assigned. But no one can be bothered with that and indeed many of the values are ambiguous. So the algorithm running the spam detection programme uses a ‘cutpoint’, a probability value above which an email is likely to be spam and below which an email can be sent to the inbox. Rather than a continuous distribution of values we now have a binary endpoint - the email either is likely to be spam, or is not.
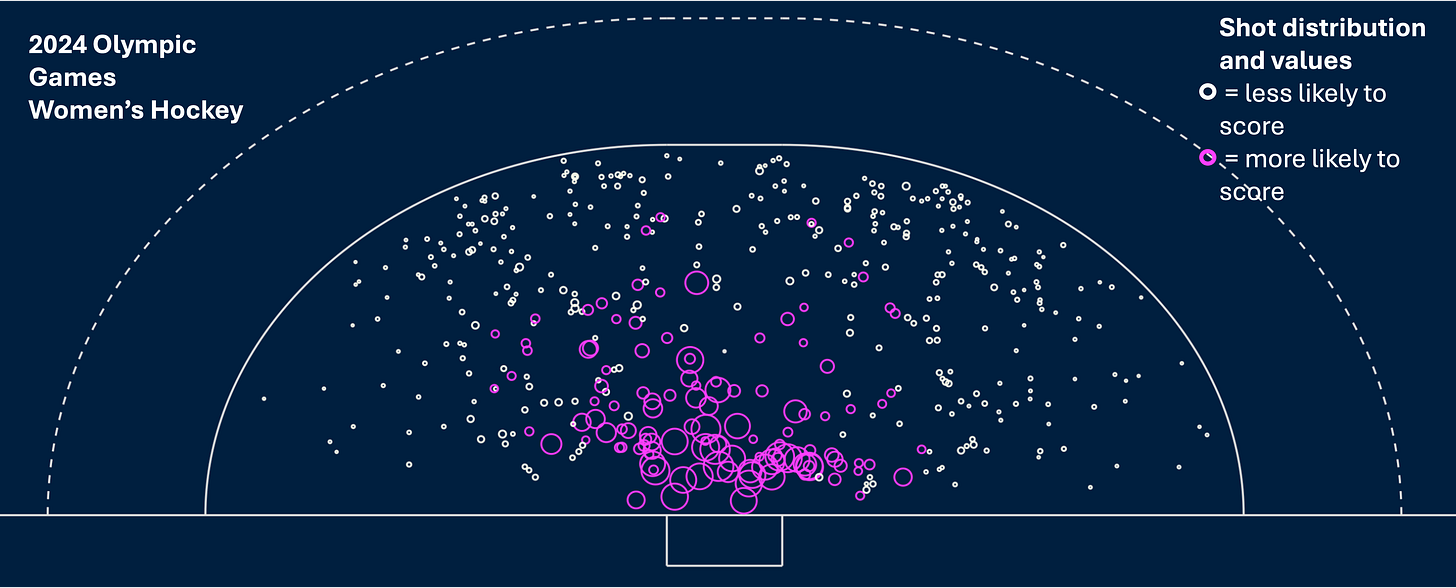
We can do the same with shot values. Determine the cutpoint above which a shot is ‘more likely to be a goal’ and below which the shot is ‘less likely to be a goal’. That value is about 0.17 and separating the shots out into more and less likely for the 2024 Olympic dataset shown in Figure 2 looks like this.
Shot position in the circle is clearly important but it is not, as the ‘more likely to score’ shot circles indicate, the whole story. Other factors are also important in determining shot success.
And we still need to generalise this output to help players think about their shooting. Telling them they should be seeking shooting conditions that result in a scoring probability greater than 0.17 is obviously meaningless. But the process of simplifying the wide variation in specific shot values to this binary classification allows us to go back and look for commonalities in the dataset that may ultimately frame the conditions under which shooting decisions can (or arguably ‘should’) be made.
We can also play with the data. Model building uses raw information about shots taken from sundry matches. But once the model is built one can simulate combinations of parameter values to see how they change and interact with one another to produce different patterns of scoring probability. That is something I’ll show in the next article.


Do you have the possibility to determine how many of those low probability shots, below 0.17, could also have been an assist looking for a deflection or rebound opportunity?
Hi Simon. Thank you for the great insights. I am a dad of a fairly young striker and we are always looking at how she can improve her goal scoring as well as her positioning in the D (the sweet spot seems to be from the p flick spot all the way to just in front of the keeper?). Just two quick questions: 1. What is the goal conversion rate for a forward under the age of 18 (in general)-shots taken versus goals scored? 2. From the data above is it possible to see how many goals were scored from cutbacks? Kind regards. Jeremy (South Africa).